


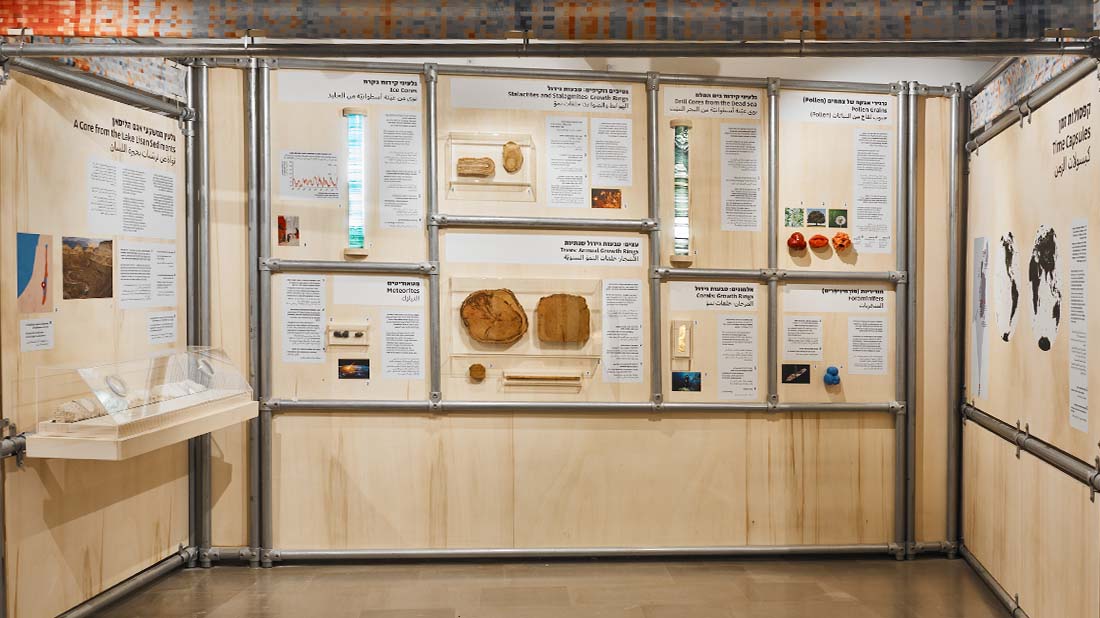
Various natural structures, such as icebergs, tree trunks, soil layers and corals, are built in layers over thousands or even millions of years. The composition of the layers is affected by the environmental conditions during their formation, thus the layers serve as indicators of the climate that was here in the past. Examining the layers and comparing the data from different indicators allows us to reconstruct the climate history, at both local and global scales. In the exhibition, “Global Warning: The Climate, the Crisis and Us”, you can see examples of such indicators, most of them from our region.

Drill core
Sediments from Lake Lisan
During the last ice age, 70-14 thousand years ago, there was an ancient lake in the Dead Sea region called Lake Lisan (tongue), because of its shape. At its peak the lake stretched from the Sea of Galilee in the north to Hatzeva in the south. Alluvium and minerals in the lake water sank down and accumulated on the lakebed. Sampling and analysis of these materials allows researchers to reconstruct the environmental conditions that prevailed in the region. The drill core on display in the exhibition, “Global Warning”, presents 1,000 years of lake sediments from 25,000 years ago. Each pair of layers, light and dark, represents one year of the lake’s existence. The light layers represent the dry season (summer), in which calcareous (chalky) materials precipitate. The dark layers contain alluvium from the winter floods. The thickness of the layers tells us about significant flooding events. Thus, for example, thick, dark layers indicate periods of flooding and thin, dark layers indicate drier periods with increased evaporation.

Layers in the drill core from Lake Lisan
Dead Sea
Scientific core drilling in the Dead Sea bed has provided samples from a depth of up to 465 m. The samples facilitated reconstruction of the climate during the last 220 thousand years in our region. Here too, the dark layers represent the rainy season and they contain alluvium from the floods, while the white layers contain salt that precipitated during very dry periods in the lake’s drainage area.
Ice
During iceberg formation, a large amount of snow piles up on the ground and is compacted into ice, trapping tiny bubbles of air. These bubbles allow researchers to learn about the composition of gases and their concentrations in the atmosphere during the period in which the iceberg’s layers were formed, and to also learn about the temperature that prevailed at that time. By analyzing the layers in drill cores researchers discovered that the concentration of carbon dioxide (CO2) was cyclical for hundreds of thousands of years, but from about 1950 (Industrial Revolution) its concentration has risen constantly at an unprecedented rate, and reached levels that have not been observed for at least 800,000 years, with no indication of slowing down.

Concentration of carbon dioxide in the atmosphere according to analysis of ice drill cores
Growth rings
Annual growth rings in trees
Organic materials, such as trees, can tell us what was here in the past. You may already know that the age of a tree can be estimated by counting its growth rings, but it turns out that it is also possible to estimate the amount of rain falling each year. The tree grows outwards, adding a ring of growth each year, thus the outermost ring is the newest. Here two, each pair of rings, dark and light, represents one year in the life of the tree. In this case, it’s the dark ring that represents the dry season, while the light ring develops during the rainy season. What’s important here is the thickness of the ring, since it reflects the growth rate of the tree, which gives us an indication about the amount of rain. Narrow rings indicate slow growth, probably due to a lack of rain, while wide rings indicate more rainy years, in which the tree could grow more.

Cross-sections of tree trunks. The layers represent decades of growth
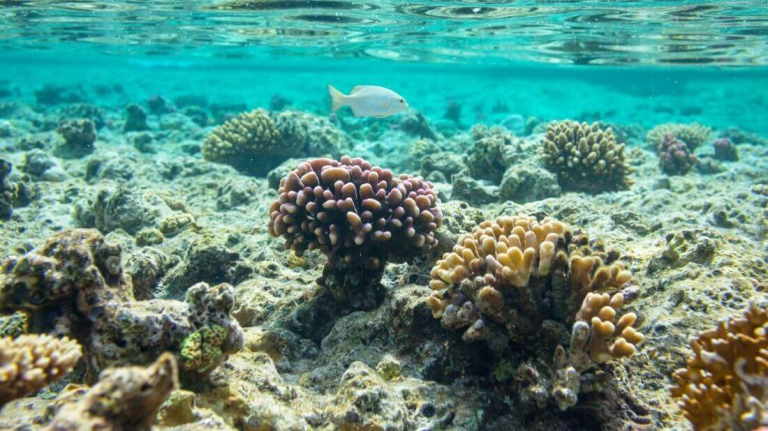
Corals
Like trees, stone coral skeletons grow gradually, in the form of annual growth rings. Chemical analysis of coral rings allows us to determine the temperature and composition of the sea water throughout the coral’s life.
Stalactites and stalagmites
The stalactites and stalagmites in Soreq Cave in the Judean Mountains document the series of changes taking place in the region during the last 250 thousand years. Stalactites and stalagmites form in caves following percolation of rainwater through layers of rock and soil. Analysis of the composition of their growth rings allows us to reconstruct the climate conditions at the time of their formation: the amount of precipitation, the temperature, and even the type of vegetation growing nearby.

On the right – cross-section of a stalactite documenting 20 thousand years; on the left – cross-section of a stalactite than began to grow about 250 thousand years
Organic matter
Foraminifers
Another way to know what climate conditions prevailed in a certain region is via microscopic organisms called foraminifers that sank to the seabed years ago. Chemical analysis of the organisms’ skeletons allows us to determine the temperature and composition of the sea water and reconstruct past climates millions of years ago.
Pollen grains
Pollen grains are the male reproductive cells of plants. Their microscopic size and resistant cell wall allow them to be preserved as fossils for thousands of years. Anyone who has grown plants at home knows that each plant needs certain growing conditions for its survival. Therefore, detection of pollen grains in ancient layers can tell us which plants lived in different regions and different time periods, and thus make conclusions about the climate conditions prevailing in the past. Studies conducted in our region have shown that pollen grains of Palestine oak are a good indicator of humidity, while those of wormwood are a good indicator of aridity.